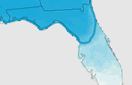


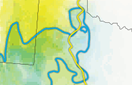
Each map is a visual guide to where a particular bird species may find the climate conditions it needs to survive in the future. We call this the bird’s “climatic range.”
The colors indicate the season in which the bird may find suitable conditions— blue for winter, yellow for summer (breeding), and green for where they overlap (indicating their presence year-round).
The darker the shaded area, the more likely it is the bird species will find suitable climate conditions to survive there.
The outline of the approximate current range for each season remains fixed in each frame, allowing you to compare how the range will expand, contract, or shift in the future.
The first frame of the animation shows where the bird can find a suitable climate today (based on data from 2000). The next three frames predict where this bird’s suitable climate may shift in the future—one frame each for 2020, 2050, and 2080.
You can play or pause the animation with the orange button in the lower left, or select an individual frame to study by clicking on its year.
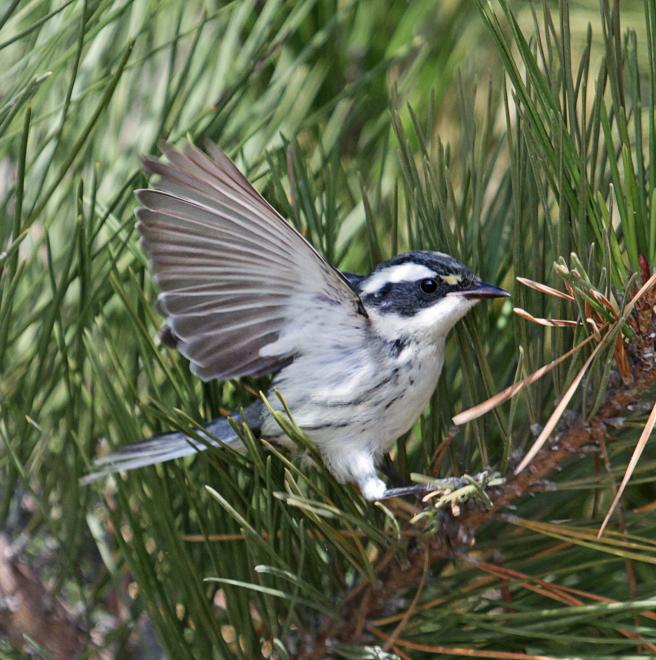
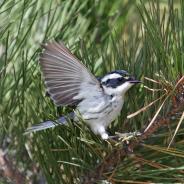
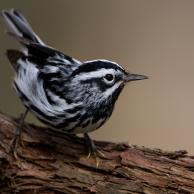
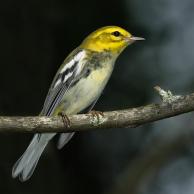
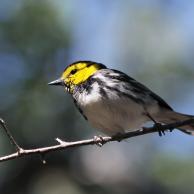
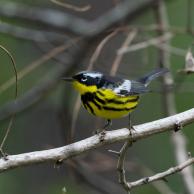
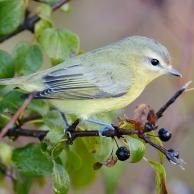
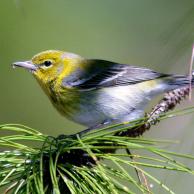
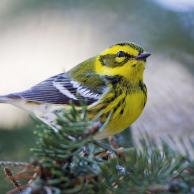
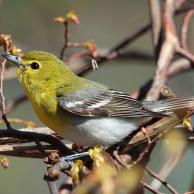
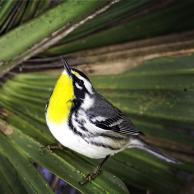
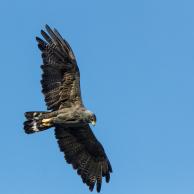
The buzzy song of the Black-throated Gray Warbler is a quintessential sound of scrubby oak, pinyon, and juniper-covered hills of western North America. Audubon’s climate model projects a significant shift in summer climate space with only 36% of the current area being stable. Most Black-throated Gray Warblers winter in central and western Mexico, outside of the domain of the model.
Explore more birds threatened by climate change around the country.


It's easier than you think to make a difference. Become an Audubon member today to help birds facing climate change.